Introduction to plotting
The plotting revolves around the Plot and classes that provide
an interface to both matplotlib and bsb:
Plot
This class provides an interface to matplotlib to create plots.
This class will create a matplotlib Figure and its Axes.
fig_size: Tuple giving the size of the figure in inches.nb_rows: Number of rows of panels to create within the figurenb_cols: Number of columns of panels to create within the figuredict_colors: A Dictionary linking the name of the elements (e.g.: cells, fibers) to plot to their RGBA color
Interface
get_ax()
Through this function, you can access each ax of the figure based on its index if you wish to manually change the plot. Indexes goes left to right, then top to bottom.
plot()
If you wish to create your own plots, you would have to implement this function:
def plot(self, *args, **kwargs):
    super().plot()
    # Insert your code here.
Note that as long as this function was not run, the axes will not be up-to-date (check the
is_plotted flag)
update()
In case your plot needs to precompute some data before plotting it, this function should be implemented:
def update(self):
    super().update()
    # Insert your code here.
The update function will be called, if need be, before plotting the data (based on the
is_updated flag)
show()
This function allow you to see your plot in a separate window. If you are running your python program in a terminal, this window will be interactive and you will be able to display the data, zoom and/or manipulate the plot.
save_figure()
This function will save the current figure as an image in the provided filename. Use it if you need to save your figures separately.
ScaffoldPlot
This class extends Plot to provide an additional interface to plot results from a BSB scaffold.
scaffold: BSB scaffold object.
Report
This class groups plots of the into a report that can be saved in a external pdf file. It will also guarantees that each of its subplots uses the same color scheme for each element in common.
cell_types_info: List ofPlotTypeInfo. This gives for each element to plot, its name, abbreviation and color.
Plots will be saved in a dictionary linking their name to the Plot instance.
You can use the plot name to save or show it through respectively the save_plot and
show_plot functions.
Interface
add_plot()
Add a plot to the report’ s list of plots. The name used here will be used to refer to the plot.
show()
Show all the plots of the report one after the other.
print_report()
Save the report into a pdf file. Each plot will be saved in a separate page matching the plot size.
BSBReport
This class extends Report to provide an additional interface to plot results from a BSB scaffold.
scaffold: Scaffold instance or path to the BSB Scaffold file to load
Classes extending from BSBReport will also used by default the
LIST_CT_INFO for cell_types_info.
This means the following colors will be used to plot the following cells and fibers:
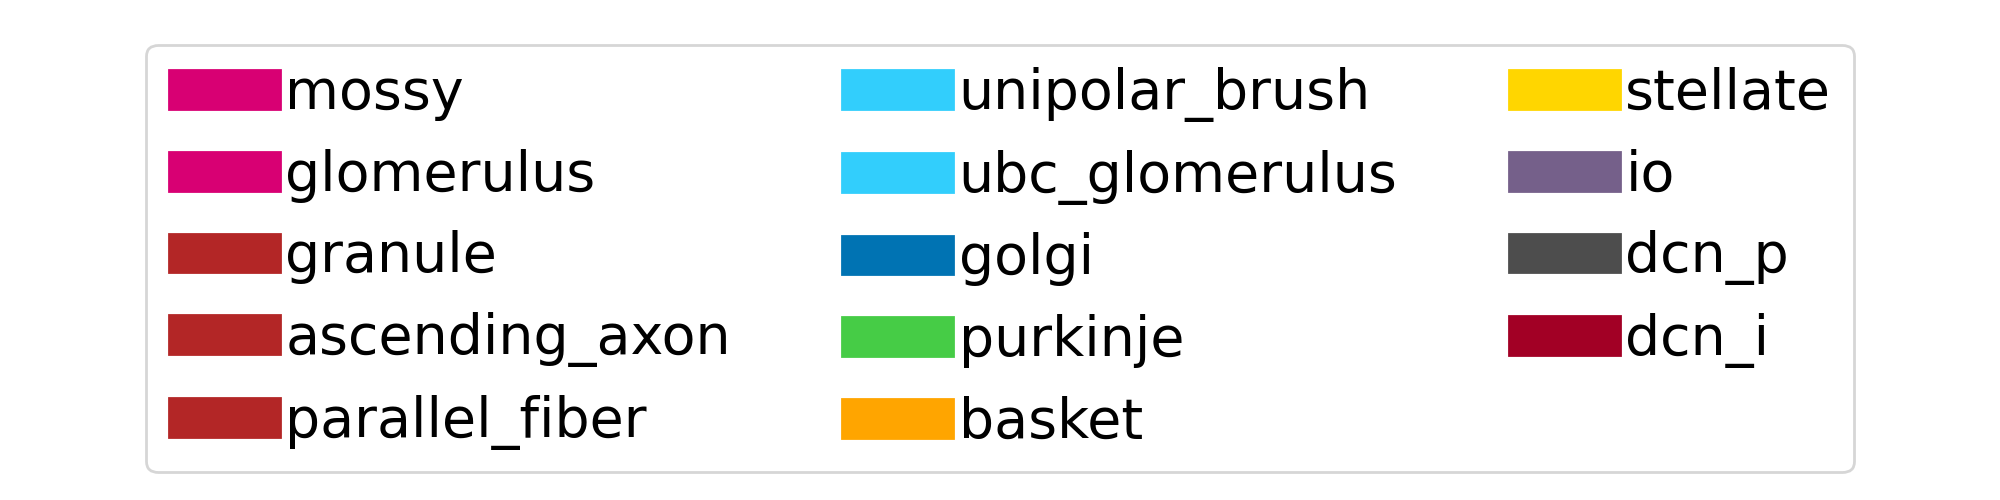
Fig. 3 Default color legend used to represent the different cells and fibers of the cerebellum reconstructions.